Call Center Agent Utilization: How to Track and Maximize It
Your call center agents are logged in for eight hours, but only five of those hours are spent helping customers. The rest is a mix of idle time, after-call work, meetings, and waiting for the next call.
That gap between "clocked in" and "productive" is exactly what agent utilization measures. If you're not tracking it, you're missing critical information for staffing, forecasting, and operational efficiency.
Agent utilization is one of the most important call center metrics, but it's also one of the most misunderstood. Get it right and you can optimize your workforce management strategy, reduce costs, and keep your team performing well without burning them out. Get it wrong and you're either overspending on idle agents or grinding your best people into the ground.
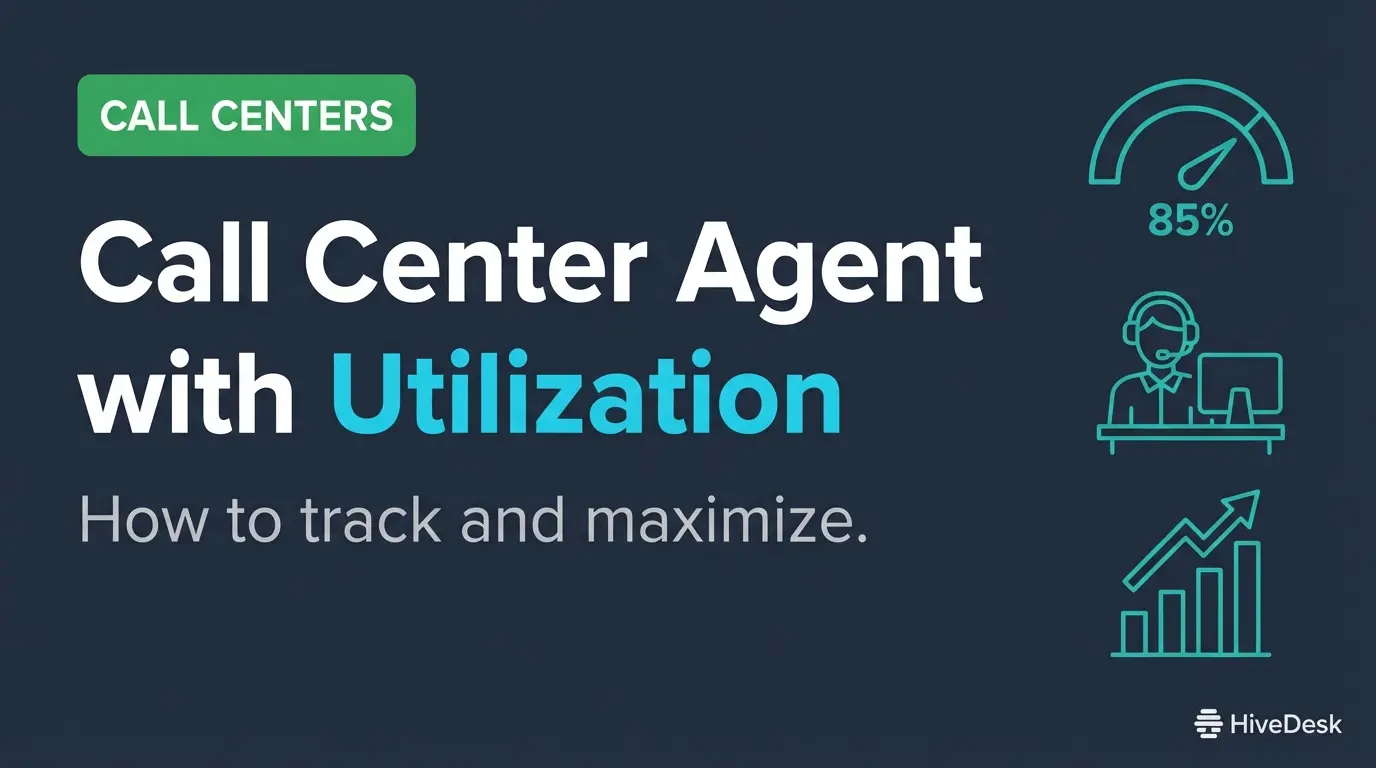
- Agent utilization measures the percentage of logged-in time spent on productive work — the ideal range is 75% to 85%
- Utilization and occupancy rate are different metrics that tell different stories — track both together for a complete picture
- The formula is: (Total Handle Time + After-Call Work) / Total Logged-In Time
- Pushing utilization above 85% risks burnout, higher turnover, and declining customer satisfaction
- Improve utilization through better forecasting, streamlined ACW, self-service options, and real-time monitoring
What Is Call Center Agent Utilization?
Agent utilization is the percentage of time a call center agent spends on productive work compared to their total logged-in time. It answers a straightforward question: how much of each agent's paid shift is actually spent on customer interactions and related tasks?
Productive work typically includes:
- Talk time on inbound or outbound customer calls
- After-call work (ACW) like writing case notes, updating the CRM, or scheduling follow-ups
- Handling customer inquiries through chat, email, or other channels
What it does not include: time agents spend waiting for calls, sitting in meetings, taking breaks, or completing training sessions.
Unlike average handle time (AHT), which focuses on individual calls, agent utilization gives you a broader view of how effectively your contact center is staffed and scheduled. It directly affects forecasting, budgeting, and workload management.
The important nuance: high utilization can mean your center is running efficiently. But if it stays too high for too long, agents burn out, service quality drops, and retention suffers. Too low, and you're paying for idle time. The goal is balance.
Agent Utilization vs. Occupancy Rate
These two metrics get confused frequently, so it's worth clarifying the difference.
Agent utilization measures the percentage of time an agent spends on productive work across their entire shift. If an agent is logged in for eight hours, utilization looks at how much of that total time was spent handling calls, completing ACW, and doing other productive work.
Occupancy rate is narrower. It only measures how much time an agent spends handling calls while in an "available" state — meaning they're ready and waiting to take calls.
The formulas:
- Utilization = productive work time / total logged-in time
- Occupancy rate = handle time / time available to take calls
Both metrics matter and tell different stories. High occupancy with low utilization might mean agents are busy when available but spending too much time in meetings, training, or off-queue activities. High utilization paired with high occupancy is a red flag for burnout — the team has almost no breathing room between calls.
Tracking both together gives you a much clearer picture of agent performance and where scheduling might need adjustment. For a broader view of how these metrics connect to organizational strategy, see our guide on the difference between people analytics and workforce analytics.
Agent Utilization Benchmarks
What counts as a good utilization rate depends on your contact center's size, call volume, industry, and the complexity of customer issues you handle. Most workforce management experts agree that 75% to 85% is the target range for most call centers. (Benchmarks are lower outside contact centers — our general utilization rate guide covers professional services, agencies, legal, and IT.)
| Utilization Range | What It Means |
|---|---|
| Below 60% | Underutilized. Review staffing levels, scheduling, and call volume trends. |
| 60% to 74% | Moderate. Could be an intentional buffer for complex work or a sign of mild inefficiency. |
| 75% to 85% | Ideal range. Agents are productive without being overworked. |
| Above 85% | High risk. Expect higher burnout, increased turnover, lower CSAT, and declining FCR. |
Don't apply a single benchmark across every team. Compare utilization by shift, channel, and role. What looks ideal for a straightforward billing support team might be unrealistic for a technical support group handling complex, multi-step issues. An outbound sales team will look different from an inbound service desk.
Use dashboards in your workforce management platform to break down benchmarks by team and time period so you can spot patterns rather than reacting to snapshots.
Important
Don't apply a single utilization benchmark across all teams. A billing support team handling simple calls will naturally have higher utilization than a technical support group managing complex, multi-step issues. Benchmark by team, channel, and role.
The Agent Utilization Formula
The calculation is straightforward:
Agent Utilization = (Total Handle Time + After-Call Work Time) / Total Logged-In Time
Breaking down each component:
- Total Handle Time: Time an agent spends actively on calls with customers, including talk time and hold time.
- After-Call Work (ACW): Time spent wrapping up after a call — writing notes, updating records, sending follow-up emails.
- Total Logged-In Time: The entire shift from login to logout, including idle time, breaks, meetings, and everything in between.
Example Calculation
An agent is logged in for 8 hours (480 minutes). During that shift, they spend 5.5 hours (330 minutes) on customer calls and 30 minutes on after-call work.
(330 + 30) / 480 = 0.75, or 75% utilization
That puts them in the ideal range.
A Note on Consistency
This formula does not automatically account for breaks, training sessions, or team meetings unless you specifically exclude those from "logged-in time." Whatever definition you choose, apply it consistently across your entire contact center. Inconsistent definitions make it impossible to compare productivity across teams or shifts. Consistent time records also support time tracking compliance with labor laws that govern overtime and record-keeping.
How to Calculate Agent Utilization Step by Step
1. Pick a Consistent Time Frame
Decide whether you're measuring daily, weekly, or by shift. Daily tracking catches issues in real time. Weekly averages smooth out day-to-day volume swings.
2. Gather Your Data
Pull the numbers from your workforce management platform, ACD system, or agent activity logs:
- Total handle time (including talk time and hold time)
- After-call work time
- Total logged-in time
Most modern WFM tools track these automatically.
3. Run the Formula
Plug in the numbers: (Handle Time + ACW Time) / Logged-In Time
4. Calculate Averages and Look for Patterns
Don't stop at individual agents. Calculate average utilization across teams, roles, shifts, and channels. You might find that your morning shift is underutilized while the afternoon crew is stretched thin, or that one team consistently runs above 85% while another hovers around 65%.
These patterns point to specific, actionable changes in scheduling and staffing.
Track Agent Utilization in Real Time
HiveDesk gives call center managers automatic time tracking, activity monitoring, and real-time dashboards to measure how agent time is actually spent. Try it free for 14 days.
Factors That Influence Agent Utilization
Several factors push utilization up or down. Understanding them helps you make better decisions.
Call Volume and Patterns
Higher call volume drives utilization up, but unpredictable spikes or uneven distribution throughout the day create problems. Overstaffed during slow periods and understaffed during peaks drags down overall numbers and increases customer wait times.
Good forecasting that accounts for seasonal trends, day-of-week patterns, and marketing campaigns makes a significant difference.
Scheduling Efficiency
If your scheduling strategy doesn't align with actual demand, you'll see the results in utilization numbers. Poor scheduling leads to either overutilization (stressed agents, rising abandonment rates) or underutilization (wasted payroll, excessive idle time).
The number of agents on the floor at any given time should match your forecasted call volume as closely as possible.
Call Complexity
Not all calls are equal. A simple billing question might take three minutes while a complex technical issue takes thirty. If your agents handle mostly complex issues, their utilization might be lower — and that's not necessarily a problem.
Factor call complexity into your benchmarks. Expecting the same utilization from a Tier 1 help desk and a specialized B2B support team is unrealistic.
Tools and Workflows
Manual tasks, unclear workflows, and toggling between multiple systems slow agents down. When agents spend time copying information between screens, searching a poorly organized knowledge base, or navigating clunky processes, that's time spent on friction rather than customer interactions.
Streamlined tools and well-designed workflows reduce wasted time and naturally improve utilization.
Training and Coaching
Training, coaching sessions, and team meetings are essential for long-term performance but pull agents off the phones in the short term. The key is balance: too little training and quality suffers; too much and utilization drops.
Schedule training during naturally low-volume periods to minimize the impact.
After-Call Work Time
Excessive ACW is one of the most common drags on utilization. If agents spend two to three minutes wrapping up every call, that adds up fast across hundreds of daily interactions. Even small reductions in average ACW time meaningfully improve overall utilization.
Best Practices to Improve Agent Utilization
Knowing your utilization rate is step one. Improving it without sacrificing customer satisfaction or agent wellbeing is where the real work happens.
Improve Forecasting and Scheduling
Use historical data, seasonal trends, and real-time insights to match staffing with demand. When forecasting is accurate, you have the right number of agents at the right times, which naturally pushes utilization toward the 75% to 85% range.
Refine your forecasting models regularly. Even small improvements in forecast accuracy have a meaningful impact on operational efficiency.
Automate Low-Value Tasks
Free up agents for meaningful customer interactions by automating repetitive work. Automated call logging, ticket tagging, data entry, and disposition coding save agents several minutes per call. Over a full shift, those minutes add up to significantly more productive time.
Streamline After-Call Work
ACW is necessary, but it doesn't need to take as long as it often does. Effective approaches include:
- Pre-built templates for common call types
- CRM integrations that auto-populate fields based on the interaction
- Simplified disposition codes that agents can select quickly
- Standardized note formats that reduce decision fatigue
Every 30 seconds you shave off ACW across your team compounds into hours of recovered productive time each week.
Target ACW for Quick Wins
After-call work is often the easiest lever for improving utilization. Pre-built templates, auto-populated CRM fields, and simplified disposition codes can save 30-60 seconds per call — compounding into hours of recovered productive time weekly.
Invest in Self-Service Options
Not every customer inquiry needs a live agent. Strong self-service options — a well-organized knowledge base, effective IVR systems, and FAQ resources — deflect straightforward questions away from agents. This lets your team focus on complex issues that genuinely require human help.
The result is better utilization of agent time and shorter wait times for customers who need to speak with someone.
Use Real-Time Monitoring
Don't wait until the end of the week to discover utilization problems. Real-time dashboards let supervisors see which agents are idle, where queues are building, and whether service level targets are at risk.
With real-time visibility, you can make intraday adjustments — moving agents between queues, adjusting break schedules, or bringing in additional staff to keep utilization on track.
Balance Metrics with Agent Experience
Utilization should never be the only metric you optimize for. Pushing utilization to 95% will likely drop customer satisfaction, hurt FCR, and drive your best agents to look for other jobs.
Balance utilization goals with metrics that reflect the full picture:
- CSAT and NPS for customer experience
- First call resolution (FCR) for effectiveness
- Abandonment rate and service level for accessibility
- Agent satisfaction and retention for team health
The most productive call centers aren't the ones squeezing every second out of their agents. They're the ones building systems that support productivity while maintaining service quality.
Coach Continuously
Traditional QA reviews happen days or weeks after a call. By then, agents have repeated the same mistakes multiple times. Shift toward more frequent, lighter coaching sessions that address issues closer to when they happen.
Use call monitoring, real-time feedback tools, and targeted micro-coaching to help agents improve without pulling them off the floor for extended periods. This approach minimizes the impact on utilization while driving meaningful performance improvements.
Putting It All Together
Agent utilization is one of the most valuable productivity metrics in your contact center, but only when used wisely. It's not about micromanaging every minute or squeezing the absolute maximum out of your team.
It's about building systems and workflows that reduce inefficiencies, support your agents, and ensure their time is spent where it matters most: resolving customer issues and delivering a good experience.
Track it consistently. Benchmark it fairly. Act on what the data tells you. And always remember that behind every utilization number is a real person. The best call centers improve operational efficiency while making the job better for their agents, not worse.
How HiveDesk Helps You Track Agent Utilization
Accurate utilization data starts with accurate time tracking. HiveDesk gives call center managers the tools to measure and improve how agent time is spent:
- Automatic time tracking — precise records of agent work hours without manual timesheets
- Activity monitoring — periodic screenshots and activity levels to understand how time is actually used
- Real-time dashboards — see who's working, who's idle, and where queues are building
- Performance analytics — historical data to identify patterns, benchmark teams, and refine your scheduling
- Attendance management — track clock-ins, breaks, and shift adherence
All at $5/user/month with every feature included. Start a 14-day free trial — no credit card required.
Track Agent Utilization with Real-Time Data
HiveDesk provides automatic time tracking, activity monitoring, and real-time dashboards so you can measure and improve agent utilization. $5/user/month, all features included.