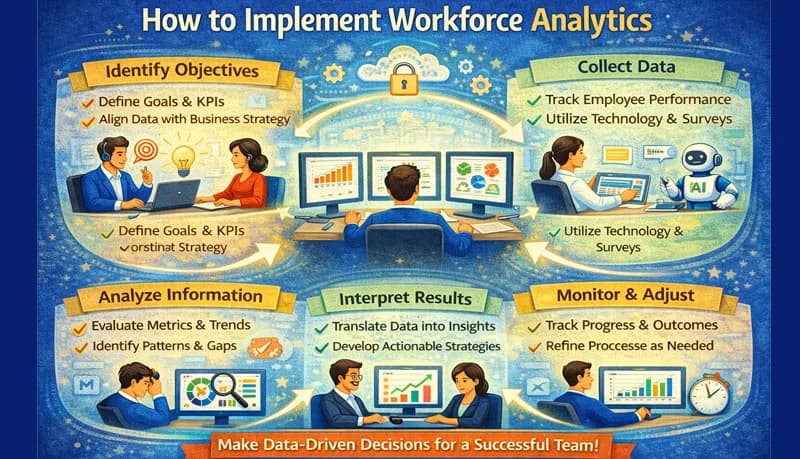
How to Implement Workforce Analytics in a Call Center
Most call centers and BPOs already have the data they need for workforce analytics. The ACD logs every call. The WFM system tracks every schedule and adherence event. The QA program scores calls. HR has hire dates, separation dates, and supervisors. Time tracking captures hours worked.
The problem is rarely "we do not have data." It is that the data sits in separate systems, gets compiled into reports that no one reads, and does not connect to specific operational decisions. Implementing workforce analytics is not about buying a new platform — it is about connecting the data you already have to the decisions you need to make, and building a cadence that ensures those decisions actually happen.
For the conceptual framework — what metrics to track and what questions they answer — see our workforce analytics overview. This post covers the practical steps of implementation.
Start with decisions, not data
The most common implementation mistake is starting with data collection and hoping insights will emerge. Start instead with the decisions your operation needs to make regularly, then determine what data each decision requires.
| Decision | Frequency | Data needed | Source |
|---|---|---|---|
| Do we have enough agents on the phones right now? | Real-time | Service level by interval, agent count vs. required, abandonment rate | ACD, WFM |
| Are agents following their schedules? | Daily | Schedule adherence by agent and team | WFM |
| Which agents need coaching, and on what? | Weekly | AHT, quality scores, FCR by agent; trend over 4–8 weeks | ACD, QA, CRM |
| Is overtime sustainable or do we need to hire? | Weekly | Overtime hours by team, open positions, training pipeline | WFM, HR, payroll |
| Are we retaining the people we want to keep? | Monthly | Retention rate by supervisor, tenure band, account; voluntary vs. involuntary split | HR |
| Is this client account profitable? | Monthly | Revenue, agent hours, loaded labor cost, account-level overhead | Finance, WFM, HR |
| Are we staffing correctly for next month? | Monthly | Forecast vs. actual volume trends, attrition pipeline, training class capacity | WFM, HR |
This table is your analytics requirements document. Every metric you track should map to at least one decision in this list. If a metric does not inform a specific decision, you do not need to track it.
Audit what you already have
Before buying anything or building anything, inventory the data you are already collecting. Most call centers discover they have 80% of what they need — it is just fragmented across systems.
Walk through each system:
| System | What to check | Common gaps |
|---|---|---|
| ACD / phone system | Can you pull call-level data? Interval-level service level? Per-agent stats? | Some older systems require manual exports rather than API access |
| WFM | Does it track adherence by agent? Can you export schedule vs. actual? | Shrinkage categories may not be configured accurately |
| QA tool | Are evaluations stored digitally? Can you pull scores by agent, evaluator, date? | Paper-based QA programs need to move digital before analysis is possible |
| CRM / ticketing | Can you identify repeat contacts from the same customer within 7 days? | FCR tracking requires a reliable customer identifier across contacts |
| HR system | Does it capture separation reason (voluntary, involuntary, subcategories)? Supervisor assignment? | Many HRIS systems have a single "termination" code — you need subcategories |
| Time tracking | Are hours tracked automatically or self-reported? | Self-reported time is unreliable for analytics — automatic tracking is necessary |
| Payroll | Can you pull hourly rates by employee, overtime hours, shift differentials? | Payroll data often lives in a separate system with limited export capability |
Common gap: the supervisor-agent mapping. Many analytics questions require knowing which supervisor manages which agents — and that mapping changes frequently. If your HRIS does not maintain a current supervisor assignment for every agent (with historical records), you cannot segment retention, quality, or adherence by supervisor. Fix this first — it unlocks the highest-value analysis you can do.
Connect the data
The value of workforce analytics comes from connecting data across systems — not from any single data source. Here are the connections that matter most:
Connection 1: ACD + QA + CRM = agent performance profile
Combining handle time (ACD) with quality scores (QA) and first-call resolution (CRM) for each agent creates a performance profile that is far more useful than any single metric.
| Agent | AHT | Quality | FCR | Profile | Action |
|---|---|---|---|---|---|
| Agent A | 7:30 | 92% | 82% | Thorough, slightly slow | Efficiency coaching — system shortcuts, call control |
| Agent B | 4:15 | 71% | 58% | Rushing | Slow down — proper process, verification steps |
| Agent C | 8:45 | 68% | 61% | Struggling | Knowledge gap — retraining, possible account reassignment |
| Agent D | 5:00 | 89% | 79% | Strong performer | Recognize, mentor role, promotion path |
Without connecting these three data sources, you would coach Agent A and Agent B the same way ("improve your numbers"), which is wrong — they have opposite problems.
Connection 2: HR + ACD + QA = retention risk identification
Combining tenure and supervisor assignment (HR) with performance trends (ACD, QA) reveals retention risk before the agent gives notice.
Signals to watch for:
- Agent with 8+ months tenure, stable performance, and no role change → stagnation risk
- Previously high-performing agent whose quality and adherence are declining over 4+ weeks → disengagement or burnout
- Agent on a supervisor whose team has above-average turnover → management quality risk
Connection 3: WFM + payroll + finance = cost analytics
Combining scheduled hours (WFM) with actual hours and pay rates (payroll) and account revenue (finance) produces cost per call by account, billable utilization, and account profitability — the metrics that determine whether a BPO is growing sustainably or losing money while adding revenue.
Build the review cadence
Data that is collected but not reviewed on a regular cadence is waste. The review cadence is the operating rhythm that turns data into decisions.
Daily stand-up (15 minutes, operations leads)
Purpose: Identify and address today's staffing and service level issues.
Review:
- Yesterday's service level by interval — any intervals missed?
- Today's scheduled agent count vs. required — any gaps?
- Adherence exceptions from yesterday — who was significantly out of adherence and why?
- Any no-call no-shows or unplanned absences affecting today?
Output: Specific actions for today — shift extensions, overtime offers, schedule adjustments.
Weekly operations review (30–45 minutes, supervisors + ops manager)
Purpose: Identify emerging trends and assign coaching and corrective actions.
Review:
- AHT trend by team — any team trending up without an explanation?
- Quality scores completed this week — any agents below threshold?
- Overtime hours by team — is overtime concentrated or distributed?
- Attendance patterns — any agents developing a pattern?
- Adherence trend by team
Output: Coaching assignments (specific agents, specific topics), scheduling adjustments for next week, escalation of any emerging problems.
Monthly business review (60 minutes, ops manager + site leadership)
Purpose: Assess operational health and make staffing, compensation, and process decisions.
Review:
- Retention by supervisor, account, and tenure band — where is attrition concentrated?
- FCR and CSAT trends — any call types or accounts declining?
- Cost per call trend — is it stable, improving, or deteriorating?
- Forecast accuracy — does the staffing model need recalibration?
- Training pipeline — are classes on schedule? Are graduates meeting quality benchmarks?
- For BPOs: account profitability and SLA compliance
Output: Hiring decisions, compensation adjustments, process changes, supervisor development actions, client discussions (for BPOs).
Quarterly strategic review (90 minutes, site leadership + executive)
Purpose: Assess business trajectory and make investment decisions.
Review:
- Retention trend — is it improving? Which interventions are working?
- Client concentration — is revenue diversification progressing?
- Site comparison (for multi-site) — are all sites performing to standard?
- Compensation benchmarking — are wages still competitive in the local market?
- Year-over-year operational metrics — is the operation getting better or worse?
Output: Budget decisions, site expansion or contraction, compensation policy changes, strategic priorities for the next quarter.
What you do not need
You do not need an enterprise analytics platform
For a call center or BPO under 500 agents, a spreadsheet-based approach works. Export data from your ACD, WFM, and HR systems into a shared spreadsheet or simple database. Build a template for each review cadence (daily, weekly, monthly) that pulls from these exports.
The discipline of the review cadence matters far more than the sophistication of the tool. A team that reviews a basic spreadsheet weekly and takes action on what they find will outperform a team with a six-figure analytics platform that generates dashboards no one looks at.
You do not need a dedicated data analyst
The operations manager, WFM analyst, and supervisors should own workforce analytics — they are the people who understand the data context and make the decisions. A dedicated analyst is useful at scale (500+ agents, multi-site), but at smaller scale, the roles that already exist should incorporate analytics into their regular responsibilities.
What you do need is someone who can extract data from your systems reliably and consistently. If pulling an ACD report or an HR data export takes hours of manual effort, that is the bottleneck to fix — either through better system access, automated exports, or a part-time admin role.
You do not need predictive models
Descriptive analytics — what happened, segmented by the right dimensions — answers 90% of the questions a call center needs to ask. "Our 90-day retention rate is 62%, and it is 71% under Supervisor A and 48% under Supervisor B" is not a prediction — it is a fact that tells you exactly where to intervene.
Predictive models (which agents are likely to leave, what next month's volume will be) are useful but are a later-stage capability. Get the descriptive analytics and review cadence working first.
Implementation sequence
If you are starting from zero, build in this order:
| Phase | Duration | What to build | Outcome |
|---|---|---|---|
| 1. Staffing basics | Weeks 1–2 | Daily service level by interval, adherence tracking, overtime report | You can answer "do we have enough people on the phones?" every day |
| 2. Agent performance | Weeks 3–4 | Combined AHT + quality + FCR view per agent, updated weekly | Supervisors know who needs coaching and on what topic |
| 3. Retention | Weeks 5–6 | Retention rate by supervisor, tenure band, account; exit reason tracking | You can identify where attrition is concentrated and why |
| 4. Cost | Weeks 7–8 | Cost per call, loaded labor cost, overtime cost analysis | You can quantify the financial impact of operational problems |
| 5. Review cadence | Week 9+ | Formalize daily/weekly/monthly reviews with templates and owners | Data drives decisions on a predictable schedule |
Each phase builds on the previous one. Do not try to build everything at once — get phase 1 working and being used before moving to phase 2. An analytics program that covers staffing basics and is actually used every day is worth more than a comprehensive program that covers everything and is used by nobody.
How to know it is working
Your analytics program is working when operational decisions change because of data. Specific indicators:
- Supervisors cite specific agent performance data in coaching conversations, not general impressions
- Staffing adjustments happen proactively (based on forecast and trend data) rather than reactively (after service level has already dropped)
- Retention interventions are targeted at specific supervisors, accounts, or tenure bands — not generic company-wide programs
- Overtime decisions are informed by cost analysis, not just "we need coverage"
- For BPOs: account profitability is reviewed monthly and informs pricing, staffing, and client retention decisions
If the reports are being generated but the decisions are the same as before the analytics program existed, the problem is not the data — it is the review cadence, the ownership, or the willingness to act on what the data shows.