Free Gantt Chart Template in Excel
Create a Gantt chart online with our free maker, or download an Excel template. Add tasks, set dates, track progress with color-coded bars.
Free Online Gantt Chart Maker
Add tasks, set start and end dates, assign team members, and track progress. Print or save as PDF when you are done.
Tasks
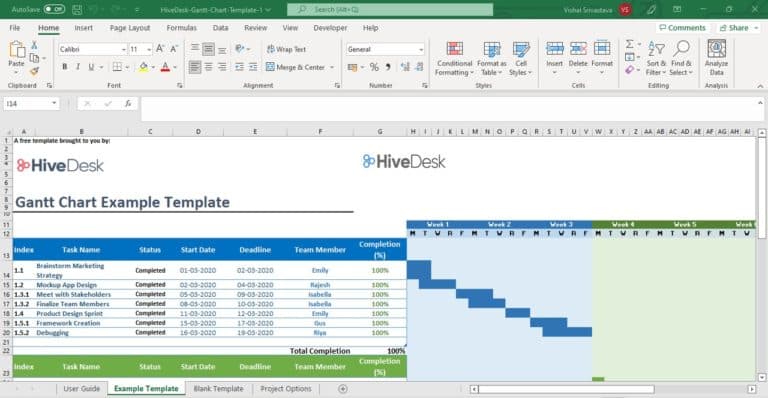
What's in the Template
The Excel workbook contains three sheets: Instructions, a Sample Gantt chart with pre-filled data, and a Blank template ready for your project.
| Field | Purpose |
|---|---|
| Index | Creates task hierarchy (1 for phases, 1.1/1.2 for tasks under that phase) |
| Task name | What needs to be done |
| Status | Not started, in progress, or completed |
| Start date | When work begins |
| End date | Deadline for the task |
| Team member | Who is responsible |
| % Complete | Progress tracking (0-100%) |
| Gantt bars | Auto-generated visual timeline from column H onward |
The Gantt chart section auto-generates color-coded horizontal bars based on your dates. You can see at a glance which tasks overlap, which are on track, and where the project stands overall.
What Is a Gantt Chart?
A Gantt chart is a bar chart that visualizes a project schedule. Named after Henry Gantt, who designed it in the early 1900s, it shows:
- •Tasks listed vertically on the left side
- •Time intervals horizontally across the top
- •Horizontal bars representing each task's duration and position in time
- •Task dependencies — which tasks must finish before others can start
- •Overall project timeline — the full span from first task to final deliverable
The task list in a Gantt chart is also called a work breakdown structure (WBS) — it breaks the project into phases and tasks within those phases, creating a manageable hierarchy.
How to Use This Template
Step 1: Download and open
Download the file and open it in Excel or upload to Google Drive for Google Sheets.
Step 2: Review the sample
Review the sample sheet to understand the layout. The index column creates the hierarchy — use "1" for the first phase, "1.1" for its first task, "1.2" for the second task, and so on.
Step 3: Enter your project
Go to the blank template sheet. Enter your project phases and tasks with their index numbers.
Step 4: Fill in details
Fill in the start date, end date, assigned team member, and status for each task.
Step 5: Track progress
Update the percent complete column as work progresses. The Gantt bars in columns H onward will reflect the timeline.
Step 6: Customize options
Use the Project Options sheet to maintain lists of team members, status values, and priorities.
Setting Up Task Dependencies
Excel makes it easy to link dependent tasks using formulas:
Start date of dependent task = End date of predecessor task + 1When you change the end date of a predecessor task, the start date of the dependent task automatically adjusts. This keeps your timeline accurate without manual updates.
For example, if "Design mockups" must finish before "Development" can start, set Development's start date to =E5+1 (where E5 is the end date of Design mockups).
When to Use a Gantt Chart vs. a Task List
Use a Gantt chart when:
- Tasks have dependencies — some can't start until others finish
- You need to visualize how tasks overlap in time
- Stakeholders need a clear picture of the project timeline
- You're managing a project with distinct phases
A simple task list is fine when:
- Tasks are independent and can be done in any order
- The project is small (under 15 tasks)
- You just need to track what's done and what's not
For complex projects, use the Gantt chart alongside the project plan template for high-level tracking and the resource allocation template to manage team workload. Agencies tracking billable hours across client projects can pair Gantt charts with time tracking for agencies to compare planned timelines against actual hours spent.
Tips for Effective Gantt Charts
Keep task granularity consistent
Tasks should represent 1-5 days of work. Anything longer should be broken into subtasks.
Update weekly
A Gantt chart that's two weeks out of date is worse than no chart at all.
Color-code by status
Green (complete), yellow (in progress), red (blocked or behind schedule).
Limit to 50-80 tasks
Beyond that, the chart becomes hard to read in Excel. For larger projects, consider dedicated project management tools.
Track actual vs. planned
Compare your original timeline to actual completion dates to improve future estimates.
Frequently Asked Questions
Common questions about using Gantt chart templates in Excel.
No. Excel has bar charts that can be adapted into Gantt charts, but there is no built-in Gantt chart type. This template does the formatting and setup for you.
Yes. Download the Excel file, upload it to Google Drive, and open with Google Sheets. The formulas and conditional formatting will carry over.
Insert new rows in the task area and follow the same index numbering convention. Copy the formulas from an existing task row to maintain the Gantt bar calculations.
You can, but it is cleaner to use one file per project and track all projects at the high level with the project plan template. This prevents the Gantt chart from becoming unmanageably long.
A project plan is a comprehensive document covering scope, budget, risks, and tasks. A Gantt chart is specifically the visual timeline component — it shows when tasks happen and how they relate to each other in time.
Automatically Track Time on Every Task
HiveDesk tracks time by project and task so you can compare planned vs. actual hours. Desktop, mobile, and browser apps. $5/user/month, all features included.