How to Calculate Agent Retention Rate in Call Centers
Agent retention rate measures how many of your agents stayed during a given period. It is the inverse of turnover rate, and while the two are related, retention rate is more useful for understanding workforce stability because it focuses on the people who remain rather than the people who left.
Most call centers track turnover. Fewer track retention in a way that produces actionable data. The difference is in how you segment the number — overall retention tells you very little, but retention by tenure, shift, team, or account tells you exactly where the problem is and what is causing it.
The retention rate formula
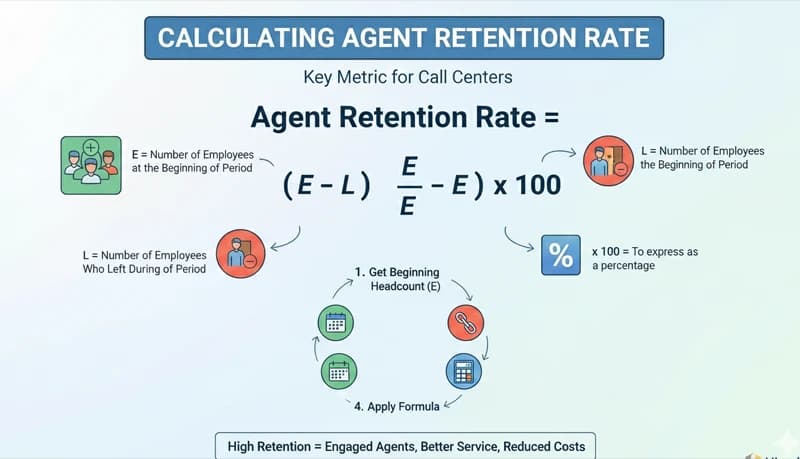
Retention rate = ((E − N) ÷ S) × 100
Where:
- S = number of agents at the start of the period
- E = number of agents at the end of the period
- N = number of new hires during the period
New hires are subtracted from the end count because retention measures how many of your existing agents stayed — not whether you backfilled departures.
Worked example
A call center starts January with 120 agents. During Q1, 18 agents leave and 22 are hired. At the end of March, the headcount is 124.
- S = 120
- E = 124
- N = 22
- Retention rate = ((124 − 22) ÷ 120) × 100 = (102 ÷ 120) × 100 = 85%
This means 85% of the agents who were on staff at the start of Q1 were still employed at the end. The quarterly turnover rate is 15%, which annualizes to roughly 60% if the trend continues.
Retention rate vs. turnover rate
| Metric | Formula | What it measures |
|---|---|---|
| Retention rate | ((E − N) ÷ S) × 100 | % of existing staff who stayed |
| Turnover rate | (Departures ÷ Average headcount) × 100 | % of positions that churned |
| Voluntary turnover | (Voluntary departures ÷ Average headcount) × 100 | % who chose to leave |
| Involuntary turnover | (Terminations ÷ Average headcount) × 100 | % removed for cause or performance |
Track all four. Retention rate and turnover rate can diverge when headcount is changing — a center that is rapidly hiring may show a decent retention rate while experiencing high turnover because new hires are masking departures.
How to segment retention for actionable data
An overall retention rate is a starting point, not a diagnosis. Segment by the dimensions below to find patterns.
By tenure
| Tenure group | What the retention rate tells you |
|---|---|
| 0–90 days | Whether your onboarding process is working. Low retention here means new hires are failing to transition from training to the floor, or the job does not match what they were told during hiring. |
| 91 days – 1 year | Whether agents survive the initial adjustment but burn out or disengage after. Often related to schedule quality, workload, or lack of development. |
| 1–2 years | Whether agents see a reason to stay long-term. Low retention at this stage typically signals limited career progression or compensation stagnation. |
| 2+ years | Your core workforce. If retention drops here, something systemic has changed — new management, policy changes, or compensation falling behind market. |
The most expensive turnover is in the 0–90 day band because you absorb the full cost of recruiting, training, and ramp-up with almost zero productive return. The most damaging turnover is in the 2+ year band because you lose institutional knowledge that cannot be replaced quickly.
By team or supervisor
Run retention by direct supervisor. If one team lead retains 90% while another retains 60% and both manage similar queues with similar agents, the difference is management — not the job itself. This is one of the most reliable patterns in retention data: agents leave managers, not companies.
By shift
Night shifts, split shifts, and weekend-heavy schedules consistently show lower retention than standard day shifts. If your overnight retention rate is 20 points below your day shift rate, that is a scheduling problem, not a hiring problem. Solutions include shift differentials, rotating undesirable shifts fairly, and eliminating clopens.
By account (for BPOs)
In BPO operations, retention varies dramatically by client account. Accounts with difficult customers, rigid scripts, unrealistic SLAs, or poor client relationships will churn agents faster than accounts with reasonable expectations. If one account has 50% annual retention while others are at 80%, the cost of that account's turnover should be factored into its profitability calculation.
By hiring source
Track which recruiting channels produce agents who stay. If agents from employee referrals retain at 85% while job board hires retain at 60%, shift your recruiting spend accordingly. The cheapest hire is not the one with the lowest recruiting cost — it is the one who stays.
What the numbers should look like
Call center retention benchmarks vary by segment, but these ranges provide context:
| Metric | Typical range | Strong performance |
|---|---|---|
| Annual retention rate | 55–70% | 75%+ |
| 90-day new hire retention | 65–80% | 85%+ |
| Annual voluntary turnover | 25–40% | Under 20% |
| Annual involuntary turnover | 5–10% | Under 8% |
If your overall annual retention is below 55%, you are replacing more than half your workforce every year. At a turnover cost of $3,000–$10,000+ per agent, this is an operational crisis, not just an HR metric.
The cost of low retention
Retention rate is an operational metric, not just a people metric. Low retention creates compounding costs:
Direct costs per departure:
| Cost component | Typical range |
|---|---|
| Recruiting (posting, screening, interviewing) | $500–$2,000 |
| Training (classroom + nesting wages) | $2,000–$5,000 |
| Productivity ramp (4–12 weeks at reduced output) | $500–$2,000 |
| Total per departure | $3,000–$9,000 |
Indirect costs that do not show up in a line item:
- Remaining agents absorb workload from vacancies, increasing their utilization and burnout risk
- Quality scores drop as the proportion of inexperienced agents increases
- Overtime costs rise to cover gaps while positions are being filled
- Supervisors spend more time on hiring and training, less on coaching and performance management
These indirect costs often exceed the direct costs. A center with 40% annual turnover and 200 agents loses 80 agents per year. At $6,000 per departure, that is $480,000 in direct costs — plus the quality, overtime, and burnout effects that are harder to quantify but equally real.
What drives agents to stay
The factors that retain agents are structural, not motivational. Understanding them helps you target interventions at what actually moves the retention number.
Compensation relative to market
Agents compare their pay to what they could earn elsewhere. If your wages are at or below market rate, compensation is a constant pull factor — agents are always one job posting away from leaving. You do not need to be the highest-paying employer, but you need to be close enough that pay is not the primary reason agents start looking.
Check local market rates annually and adjust. A $1/hour raise for 100 agents costs $208,000/year. If it prevents 10 additional departures at $6,000 each, it pays for itself in direct turnover savings alone — before accounting for the quality and overtime benefits of a more stable workforce.
Schedule predictability and fairness
Schedule quality is consistently one of the top reasons agents cite for leaving call center jobs. The specific issues:
- Schedules published with less than 2 weeks notice
- Unequal distribution of undesirable shifts
- Inability to swap shifts or request time off without excessive friction
- Clopens (closing shift followed by opening shift with insufficient rest)
These are solvable with better scheduling practices and do not require additional headcount or budget.
Frontline management quality
The relationship between an agent and their direct supervisor is the strongest predictor of whether the agent stays. Supervisors who coach rather than police, who advocate for their team's needs, and who are available when agents struggle create teams that retain.
If your retention data shows significant variation by team lead, invest in supervisor training before investing in agent perks. The manager is the intervention.
Workload sustainability
Agents who are consistently overworked — utilization above 85%, chronic overtime, insufficient breaks — will eventually leave regardless of how much they are paid. Adequate staffing is the single most effective retention intervention because it addresses utilization, overtime, break quality, and burnout simultaneously.
Early tenure support
The first 90 days are the highest-risk period. Agents who feel unprepared, unsupported, or misled about what the job involves leave quickly. A structured onboarding process with adequate nesting time, buddy assignments, and graduated performance targets dramatically improves 90-day retention.
How to track retention over time
Monthly tracking
Calculate retention rate monthly and plot the trend. A single month's number is noisy — an unusually good or bad month can swing the rate significantly. The 3-month rolling average is more useful for identifying real trends versus noise.
Cohort analysis
Track each hiring cohort separately: of the 15 agents hired in January, how many are still employed in March? June? December? Cohort analysis reveals whether retention is improving or worsening over time in a way that overall retention rate cannot, because it controls for hiring volume.
| Cohort | Hired | 90-day retention | 6-month retention | 12-month retention |
|---|---|---|---|---|
| Jan 2025 | 15 | 80% (12) | 67% (10) | 53% (8) |
| Apr 2025 | 12 | 83% (10) | 75% (9) | — |
| Jul 2025 | 18 | 89% (16) | 78% (14) | — |
In this example, 90-day and 6-month retention are improving across cohorts — suggesting that onboarding or hiring changes made between January and July are working.
Exit data
Track every departure with:
- Voluntary vs. involuntary — different causes require different interventions
- Tenure at departure — identifies which stage of the employee lifecycle is leaking
- Stated reason — from exit interviews or surveys (take with appropriate skepticism — departing agents often cite "better opportunity" even when the real reason was their manager or schedule)
- Destination — did they leave the industry, go to a competitor, or move to a different role? Agents leaving for competitors signals a compensation or conditions gap; agents leaving the industry signals burnout or job dissatisfaction.
Use this data to calculate retention rate by segment and identify which specific interventions will have the greatest impact on your overall number.
